On Saturday Benzinga ran a poll on Twitter asking whether people think Bitcoin (CRYPTO: BTC) would hit $50,000 this weekend. As of Sunday afternoon 71% of respondents chose ‘yes.’ Although Bitcoin may need a few days for further consolidation as the apex cryptocurrency looks to be preparing for another run north.
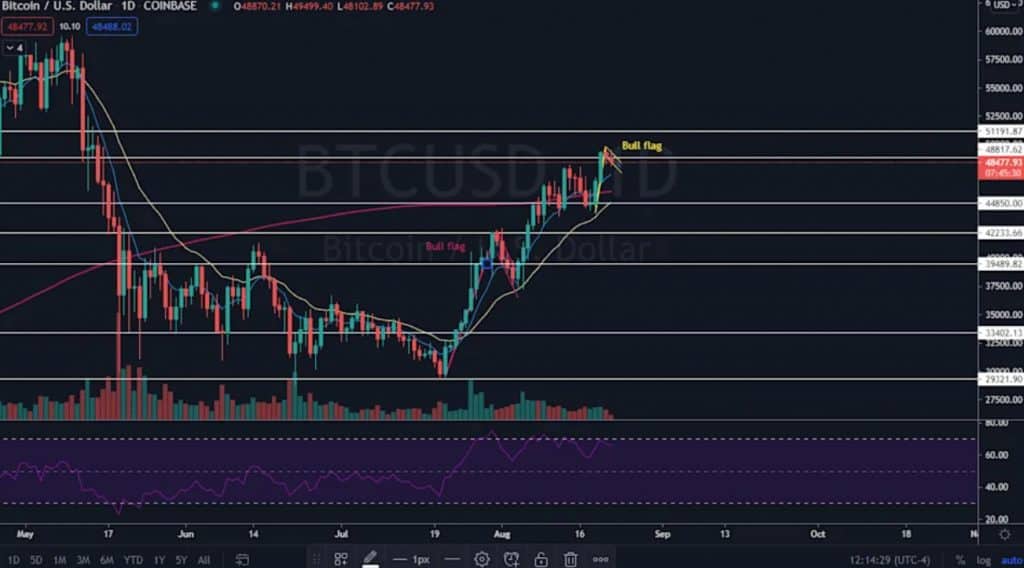
The Bitcoin Chart: Bitcoin has settled into a bull flag pattern with the pole created between Aug. 19 and Aug. 20 and the flag between Saturday and Sunday. If Bitcoin breaks up bullishly from the formation the implied measured move could see Bitcoin trade about 12.5% higher to the $54,130 level. The measured move of a bull flag pattern is taken by measuring the length of the pole and adding the same percentage or dollar value to the lowest price within the flag pattern.
The consolidation into the flag formation has helped Bitcoin to cool off its relative strength index (RSI) which was approaching the 70% level on Friday. When a crypto or stock’s RSI reaches over the 70% level it is a sell signal for technical traders. When Bitcoin reached an RSI of over 70% on July 30, Aug. 7, Aug. 9 and Aug. 13 sellers came in and dropped the crypto into consolidation.
The low trading volume on Bitcoin also signals the slightly lower prices are a consolidation. Bears should look for high volume on a move lower to feel confident the rally is over.
Bitcoin is trading above the eight-day and 21-day exponential moving averages (EMAs) with the eight-day EMA trending above the 21-day, both which are bullish indicators. The crypto is also trading above the 200-day simple moving average which indicates overall sentiment is bullish.
Bulls want to see big bullish volume come in and break Bitcoin up bullishly from the flag. The crypto has resistance above at $48,817 and $51,191.
Bears want to see big bearish volume come in and drop the crypto down out of the flag pattern and below support of the eight-day EMA. Bitcoin has support below at $44,850 and $42,223.

