Bespoke Investment’s Paul Hickey believes a market hot streak is unfolding.
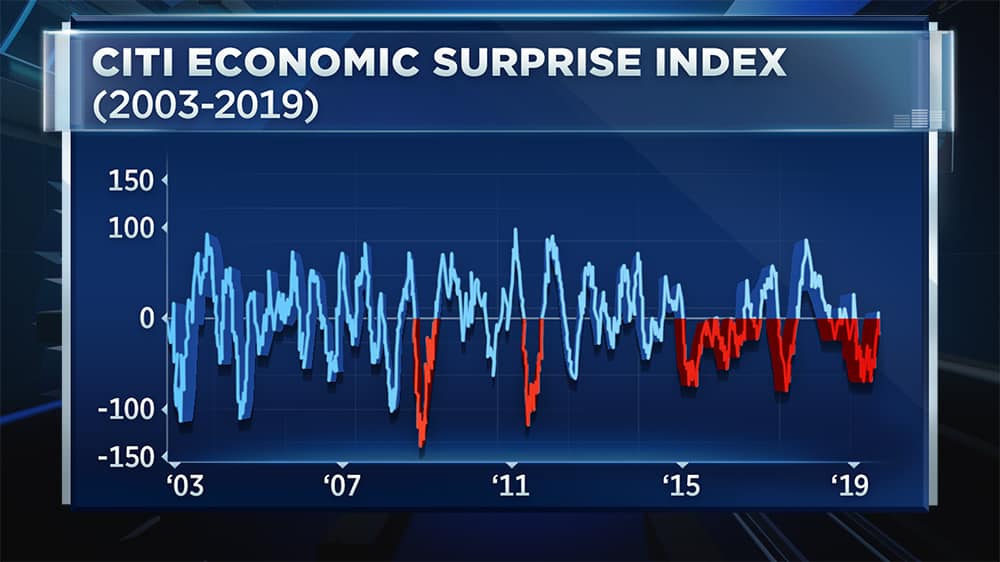
The independent market researcher is building his bullish case by zeroing in on the Citi Economic Surprise Index, which is built to measure optimism in the economy.
In the week ending Friday, the index flipped into positive after spending more than 100 days in negative territory. Hickey contends the move suggests investors are feeling more confident about the economy’s direction, so there’s a good chance stocks will rip higher.
“There are five prior periods that we’re talking about. One, three and six months later, the S&P was higher four out of five times,” Hickey told CNBC’s “Trading Nation” on Friday. “When we looked at when these prior streaks have ended and expectations have been ratcheted down enough, the market actually did quite well going forward.”
Hickey is emphasizing the trend because the gains are pretty significant.
When the index went negative for at least 100 days, he reports the S&P 500′s median gains were 4% over the next month, 6% three months later and 8.5% six months later.
And, stocks may be well on their way.
The S&P 500 and Dow are closing in on their all-time highs again. They’re now less than 2.5% away and ended the week above their 50 day moving averages.
Stocks picked up momentum after President Donald Trump indicated trade talks with China were getting back on track, and economic data exceeded expectations.
“When it’s such a foregone conclusion in that the economy is weakening and the stock market is going to go down, that’s usually when you have the best times to catch a rally in stocks when sentiment is all looking the other way,” Hickey said.

