Stocks have been grinding sideways, but once they breakout, the move to the upside could be powerful, technical analysts say.
The S&P 500 has been edging closer to 3,028, its high from July 26, but it has backed off a number of times, creating a jagged seesaw pattern on August’s chart. On Monday, the S&P was slightly higher but still trading below the psychological 3,000 level.
“The intermediate and long term gauges that we track have relatively new buy signals. They are very widespread,” said Katie Stockton founder and chief technical strategist at Fairlead Strategies. “Even in Japan, we’re seeing signs of life from a momentum perspective. There’s potential for it to be broad-based, not limited to the U.S.”
But the stock market has not made much upside progress and the S&P 500 is only up 2.2% in the past 12 months, despite a December selloff and a recovery that began in January. There has also been tension between stocks and bonds, which have been reflecting fear of a weakening economy. The market has been shrugging off some of that concern more recently, and yields have moved off early September lows.
“There has been this disconnect between equities and the economic cycle,” said Ari Wald, technical strategist at Oppenheimer. Technical analysts are those who follow charts more than fundamentals, for clues on market direction.
During the summer, the yield curve inverted, with the 2-year yield rising above the 10-year Treasury yield, a recession warning. That part of the curve is no longer inverted, but it is fairly flat and separated by just 4 basis points.
.1569257435108.jpeg)
“Even when you paint that picture on top of it, we think the market is positioned to rally into the 2020 U.S. election,” said Wald, adding he will reassess when the November 2020 presidential election gets closer. Wald said based on past performance, the stock market could gain 20% to 25%, and in the past it has moved higher for 17 to 20 months before peaking.
“Our take is after a period of such little, poor market progress, we think returns should be better looking ahead. This looks a lot like the resets in 2011 and 2016,” he said, adding 2019 has been a base-building period after last December’s steep plunge.
Fundstrat founder and strategist Thomas Lee says these types of sideways markets have produced unusually strong gains, once they end. He pointed to three instances since WWII when the the market was near all time highs but had minor gains, within 3% over the trailing 12 months or under 5% for 20 months. Those periods were July 1952 to March 1954; May 1983 to December 1984, and November 2014 to July 2016,
“In 3 of 3 cases, the resolution was a strong upside move in S&P 500 … with an average gain of 51% over the next 24 months,” Lee wrote in a recent note. “In other words, ‘nowhere markets’ have been resolved by a massive upside breakout in stocks. This implies we could see the S&P 50 reach 4,500 by the end of 2021. This is pretty eye opening upside.”
Lee said he continues to expect a rally and his year end target is 3,125 on the S&P 500. In the three sideways markets, he noted that cyclicals led for 24 months or more.
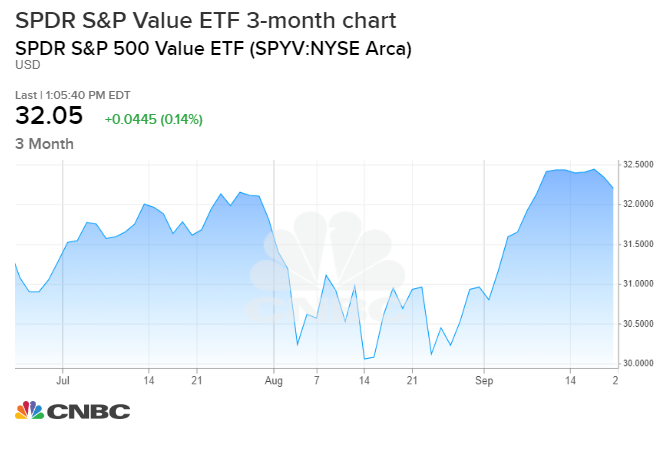
Wald said one clue that the market could be ready to breakout, is in the way value stocks have outperformed recently and small caps have been gaining, signaling broader participation from out of favor parts of the market.
.1569256167360.jpeg)
“We’ve seen these incremental new highs really since January of 2018. It hasn’t been this definitive push higher. When you look at each incremental new high, it was technology alone. If you want to see this move to highs it has to be more than technology,” he said. “This is underlying bullish, and this is a sign of aggressive risk appetite. If these stocks are going to participate, that’s a sign of broader market participation and that should be a catalyst to the upside.”
Wald said the S&P could be at 3,150 to 3,200 this year and 3,500 to 3,600 next year.
“I do think this could be the point where we could finally move higher as some of our indicators are suggesting and this could be the resumption of the bull cycle that started in December, 2018,” he said.
Stockton said the S&P faces minor resistance at its high, and a measured move from there could be to 3,120. “That would be a Q4 target,” she said, adding a longer term move would be to 3,280. She said the Russell 2000, outperforming this month with a near 4.5% gain, has a much tougher road back to highs, but if it breaks resistance that should also help large cap names.

The broader global moves are a positive signal, and a pause in the market in recent sessions could be positive and refresh the market. “With a little short term upside, a lot of these major resistance levels would be cleared and that would be a long term positive,” Stockton said.
Stockton said Euro Stoxx 600 is also near resistance, and it could breakout above 400. “A breakout would be not only a short term positive, but really a longer term positive for European equities,” she said.
Jason Hunter, head if J.P. Morgan global fixed income and equity technical strategy, said negative trade headlines have disrupted rallies twice this year. But Hunter said the trade story could become a positive, and he is holding stocks that broke out in September and should benefit if trade negotiations go well.

“If the trade story is going to give us that, we want to be there,” he said.
“For right now they’re trading above their early September breakout levels. We’ll stay engaged,” he said. The stocks he likes are embodied by the S&P value index, which includes financial, industrials and materials.
Hunter said he expects a positive trade story would propel the market, and the S&P 500 would break through trend lines at 3,040 and 3,060. “3,200 is what our fundamental guys had penciled in [as a 12-month target] and I think that’s a fair base case assumption,” he said.

